%%{init: {'flowchart': {'nodeSpacing': 20, 'rankSpacing': 30}}}%%
flowchart LR
 subgraph Pre["Preclinical"]
        D3["Preclinical<br>Testing"]
        D2["Lead<br>Optimization"]
        D1["Discovery"]
  end
 subgraph Clinical["Clinical Development"]
        P3["Phase III"]
        P2["Phase II"]
        P1["Phase I"]
  end
 subgraph Post["Regulatory"]
        R4["Phase IV"]
        R3["Approval"]
        R2["Review"]
        R1["Submission"]
  end
    D1 --> D2
    D2 --> D3
    P1 --> P2
    P2 --> P3
    R1 --> R2
    R2 --> R3
    R3 --> R4
    Pre --> Clinical
    Clinical --> Post
2 Lifecycle of a Clinical Trial
Before examining each component in detail, it helps to see the whole picture. A clinical trial is not a single event but a sequence of interconnected stages, each with its own objectives, deliverables, and regulatory checkpoints. This chapter provides a roadmap: a high-level view of how trials progress from initial concept through regulatory approval, with pointers to the chapters that explore each stage in depth.
2.1 The Big Picture
A clinical trial exists within the broader context of drug development. The molecule that enters a Phase I trial has already survived years of discovery research and preclinical testing. The trial that produces a Clinical Study Report is just one element of a regulatory submission that synthesizes evidence across multiple studies. Understanding where trials fit in this larger arc (Figure 2.1) helps explain why they are designed and conducted as they are.
The clinical development phase (where human trials occur) typically spans many years and represents the largest single investment in bringing a drug to market (U.S. Food and Drug Administration 2018; DiMasi, Grabowski, and Hansen 2016). Most candidates fail during this phase, making the design and execution of each trial consequential not only for the current study but for the entire program.
The Pipeline Misnomer
While the linear “chevron” model (Figure 2.3) provides a useful high-level roadmap, it is also a “deeply engrained misnomer” that connotes a consistent, unidirectional flow (Wagner et al. 2018). In reality, therapeutic development is a “diverse web of failure-prone iterative learning loops” traversed by scientists, physicians, regulators, and patients.
The Forum on Drug Discovery, Development, and Translation of the US National Academies of Sciences, Engineering, and Medicine proposed the Drug Discovery, Development and Deployment Map (4DM) to better capture this complexity (see Figure 2.2). Rather than a pipeline, the 4DM conceptualizes development as a set of interacting “neighborhoods” (basic science, biomarker development, clinical research, the medical landscape) where discoveries in one area can render earlier results irrelevant or create new shortcuts to later stages. This iterative nature explains why clinical trials are often designed with “reiterative loops,” where multiple “shots on goal” are required before succeeding at any step (Wagner et al. 2018).
flowchart LR
    A((Discovery &<br/>Basic Science))
    B((Biomarkers<br/>& Assays))
    C((Clinical<br/>Development))
    D((Regulatory<br/>Review))
    E((Medical<br/>Practice))

    A <--> B
    B <--> C
    C <--> D
    D <--> E
    E <--> C
    A <--> C
    B <--> D

    style A fill:#e1f5fe,stroke:#01579b
    style B fill:#fff3e0,stroke:#e65100
    style C fill:#e8f5e9,stroke:#1b5e20
    style D fill:#f3e5f5,stroke:#4a148c
    style E fill:#fff9c4,stroke:#f57f17
One implication is that failure rates are not uniform across therapeutic areas. Oncology, in particular, combines high scientific uncertainty with intense competition and heterogeneous patient populations. In the Biotechnology Innovation Organization (BIO)’s analysis of 2011–2020 development programs, the overall likelihood of approval (LOA) from Phase I was 5.3% for oncology versus 9.3% for non-oncology programs, with the largest attrition occurring at the Phase II transition (oncology Phase II-to-III success 24.6%) (Biotechnology Innovation Organization, QLS Advisors, and Informa Pharma Intelligence 2021). Academic analyses of trial outcomes reach a similar qualitative conclusion: oncology has among the lowest probabilities of advancing from early clinical testing to approval, even as biomarker-enriched programs can outperform historical averages (Wong, Siah, and Lo 2019).
2.2 Trial Phases at a Glance
Clinical trials proceed through distinct phases, each with a primary purpose (summarized in Figure 2.3 and Table 2.1). The boundaries between phases are not always sharp. Phase I/II combination studies are common, and some programs run Phase II and Phase III concurrently, but the conceptual framework remains useful.
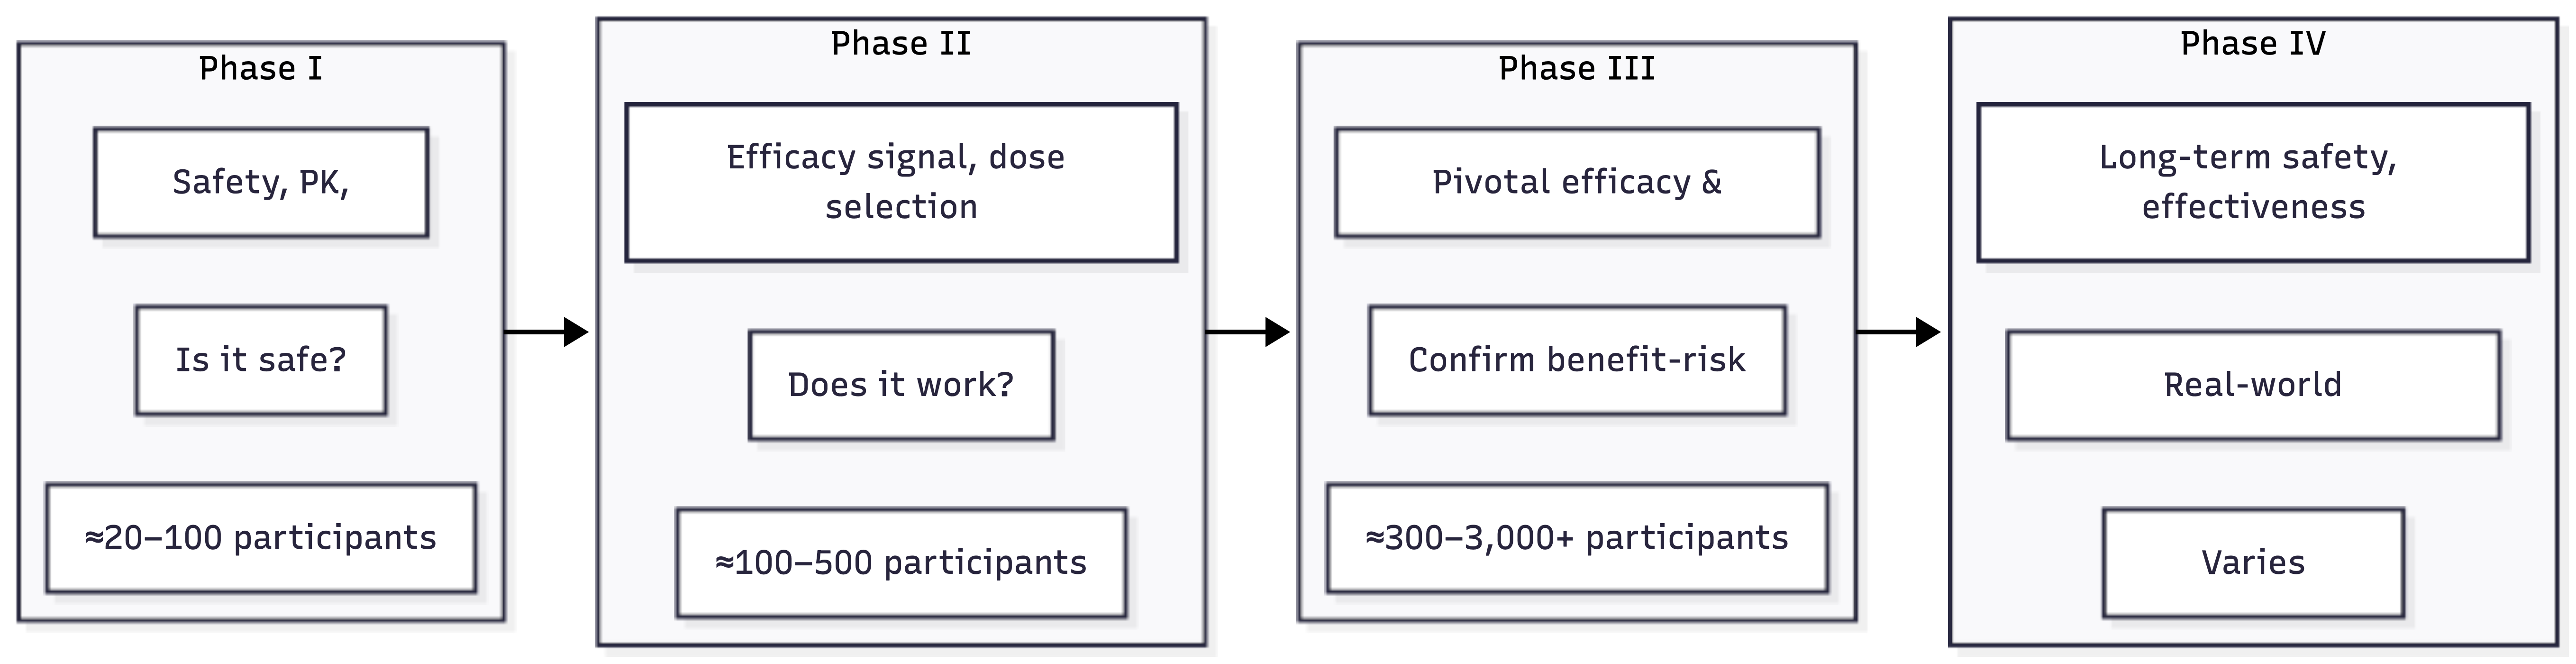
| Phase | Primary Question | Typical Size | Duration | Key Decisions |
|---|---|---|---|---|
| Phase I | Is it safe in humans? | 20-100 | 6-12 months | Dose escalation, stopping rules |
| Phase II | Does it show efficacy? | 100-500 | 1-2 years | Go/no-go, dose selection |
| Phase III | Does benefit outweigh risk? | 300-3,000+ | 2-4 years | Primary endpoint, label claims |
| Phase IV | How does it perform post-market? | Varies | Ongoing | Safety signals, new indications |
Each phase builds on the previous. Phase I establishes that the drug can be given to humans at tolerable doses. Phase II provides the first evidence of therapeutic effect and identifies the dose(s) to carry forward. Phase III confirms that the drug works in a larger, more representative population and characterizes the safety profile sufficiently to support labeling. Phase IV continues surveillance after approval.
For detailed coverage, see Chapter 7, Chapter 8, Chapter 9, and Chapter 10.
2.3 Anatomy of a Phase III Trial
Phase III trials represent the largest investment and the highest operational complexity. Understanding the lifecycle of a single Phase III trial provides a template that applies, with variations, to earlier phases as well.
flowchart LR
    subgraph Planning["Planning & Design"]
        A1["Protocol Development"] --> A2["Statistical Design"]
        A2 --> A3["Site Selection"]
        A3 --> A4["Regulatory Authorization<br/>(IND/CTA)"]
    end

    subgraph Startup["Startup"]
        B1["Ethics/IRB Approval"] --> B2["Site Contracts"]
        B2 --> B3["Site Training"]
        B3 --> B4["Site Initiation"]
    end

    subgraph Execution["Execution"]
        C1["Recruitment"] --> C2["Treatment"]
        C2 --> C3["Data Collection"]
        C3 --> C4["Monitoring"]
        C4 --> C1
    end

    subgraph Closeout["Closeout & Reporting"]
        D1["Last Patient Visit"] --> D2["Database Lock"]
        D2 --> D3["Statistical Analysis"]
        D3 --> D4["CSR & Submission"]
    end

    Planning --> Startup --> Execution --> Closeout
The lifecycle of a Phase III trial follows a structured progression from planning through closeout (see Figure 2.4).
Planning and Design
Before a single patient enrolls, months of planning occur. The protocol (the scientific and operational blueprint for the trial) specifies the objectives, design, patient population, treatments, assessments, endpoints, and analysis plan. Protocol development involves clinical, statistical, regulatory, and operational input; a poorly designed protocol creates problems that cannot be fixed during execution.
Statistical design (Chapter 11) determines sample size, randomization scheme, and analysis approach. Study design (Chapter 13) addresses the broader scientific architecture: parallel vs. crossover, superiority vs. non-inferiority, adaptive vs. fixed. The protocol benchmarks chapter (Chapter 15) examines what makes protocols operationally feasible.
Site selection (Chapter 18) identifies the investigators and institutions that will conduct the trial. Regulatory submission obtains permission to proceed: IND in the US, CTA in Europe.
Startup
Startup is the period between regulatory approval and first patient enrollment. This phase often takes longer than expected: benchmarks report an average of roughly 166 days for Phase III trials, and it is a common source of delay (Lamberti et al. 2024).
Key startup activities include obtaining ethics committee/IRB approval (Chapter 4), negotiating site contracts and budgets, training site staff on the protocol and systems, and conducting site initiation visits to verify readiness. The logistics and project management chapter (Chapter 20) covers the operational mechanics of site activation and vendor coordination.
Execution
Execution is the core of the trial: enrolling patients, administering treatments, collecting data, and monitoring quality.
Recruitment (Chapter 19) is frequently the most challenging operational element. Most trials miss their enrollment targets, and recruitment delays are a leading cause of timeline slippage.
Randomization and blinding (Chapter 16) assign patients to treatment arms while protecting the integrity of the comparison. Endpoints (Chapter 17) define what is measured and how success is determined.
Data management (Chapter 21) ensures that the information collected is accurate, complete, and ready for analysis. Monitoring (Chapter 22) provides oversight: verifying that sites are following the protocol, that data matches source documents, and that patient safety is protected.
Safety (Chapter 23) is a continuous concern throughout execution: adverse events must be identified, documented, and reported according to regulatory requirements.
The Clinical Trial IT Infrastructure chapter (Chapter 25) examines the technology systems that support execution (Electronic Data Capture (EDC), Clinical Trial Management Systems (CTMS), electronic Trial Master File (eTMF), and Randomization and Trial Supply Management (RTSM)), and the AI Agents in Clinical Development chapter (Chapter 26) explores how AI is beginning to change operational workflows.
Closeout and Reporting
After the last patient completes the last visit, the trial transitions to closeout. Database lock freezes the data for analysis. Biostatisticians execute the pre-specified analysis plan. Medical writers prepare the Clinical Study Report (Chapter 28), the document that presents the trial’s findings.
The CSR becomes part of the regulatory submission (Chapter 29): the New Drug Application (NDA), Biologics License Application (BLA), or Marketing Authorization Application (MAA) that requests marketing authorization. The essential documents chapter (Chapter 24) covers the documentation requirements that must be maintained throughout and archived after the trial.
The closeout chapter (Chapter 27) addresses the operational activities: site closeout visits, document archiving, and the administrative closure of the trial.
2.4 Cross-Cutting Concerns
Some topics span the entire trial lifecycle rather than belonging to a single phase.
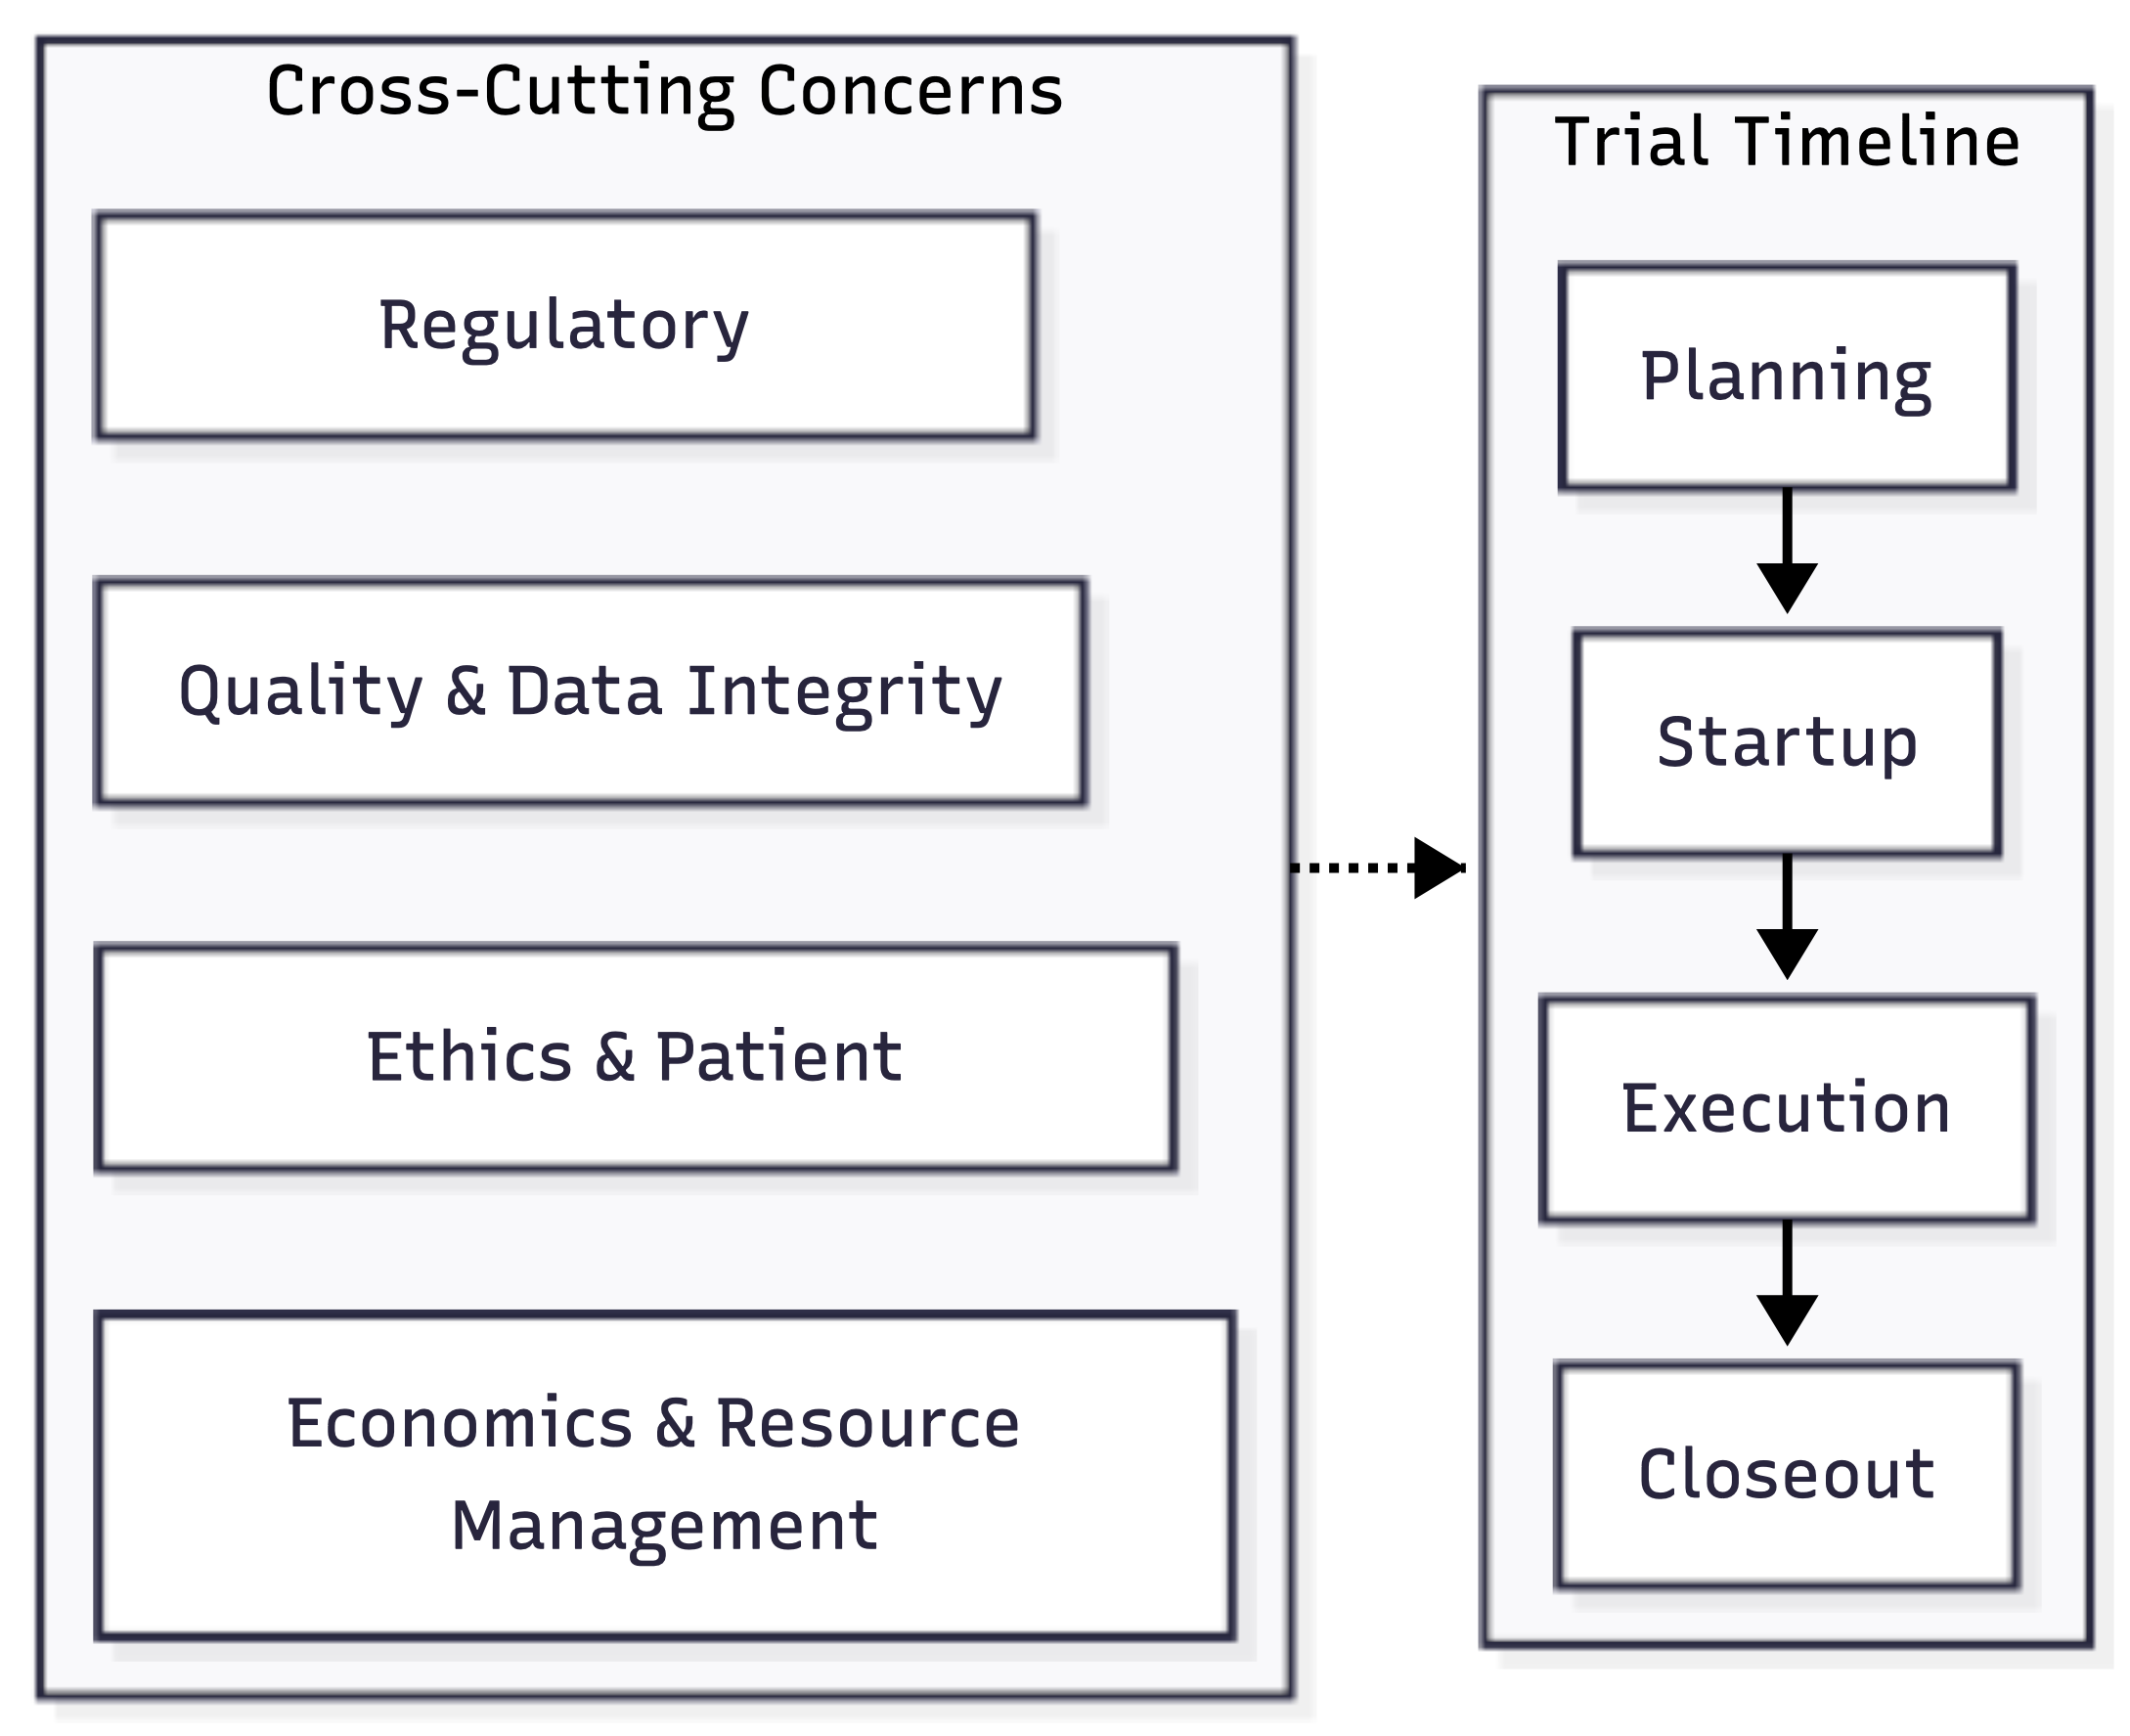
Four themes span the entire trial lifecycle (see Figure 2.5):
- Regulatory compliance: shapes everything from initial protocol design to long-term data retention
- Ethics and patient protection: informed consent and IRB oversight must be maintained from first participant to last
- Quality and data integrity: adherence to Attributable, Legible, Contemporaneous, Original, and Accurate (ALCOA) principles
- Economic constraints: multi-billion-dollar investments that define the feasibility of modern clinical development
2.5 How to Use This Book
The chapters that follow explore each element in detail. Readers with different backgrounds may navigate them differently:
For a conceptual foundation: Start with the history (Chapter 1), regulatory (Chapter 3), and ethics (Chapter 4) chapters in Part I.
For phase-specific understanding: Part II covers drug development and the progression through Phases I-IV.
For operational depth: Part III provides detailed coverage of Phase III design and execution, from statistical methods through monitoring and safety.
For the end-to-end view: Part IV covers closeout, the CSR, and regulatory submission.
For technology and AI: The IT infrastructure chapter (Chapter 25) examines core technology systems, while the AI agents chapter (Chapter 26) covers how AI is reshaping workflows.
The diagram below (Figure 2.6) provides a visual map of the book’s structure:
flowchart TB
    subgraph Part1["Part I: Foundations"]
        F1["History"] --> F2["Lifecycle"]
        F2 --> F3["Regulatory"]
        F3 --> F4["Ethics"]
    end

    subgraph Part2["Part II: Phases"]
        P1["Drug Development"] --> P2["Economics"]
        P2 --> P3["Phase I-IV"]
    end

    subgraph Part3["Part III: Phase III Deep Dive"]
        direction TB
        D1["Design & Statistics"]
        D2["Recruitment & Logistics"]
        D3["Data & Monitoring"]
        D4["Technology & Innovation"]
    end

    subgraph Part4["Part IV: Completion"]
        C1["Closeout"] --> C2["CSR"] --> C3["Submission"]
    end

    Part1 --> Part2 --> Part3 --> Part4
Throughout, we emphasize that clinical trials are both a scientific method and an operational system. The science determines what questions can be answered; the operations determine whether the trial can actually answer them. Both perspectives are essential.